The average LiDAR scan contains 250+ million points. Visualizing and sharing this data efficiently is a significant challenge for many professionals. This tutorial provides a no-code solution to visualize and manage massive point clouds early in the workflow.
Introduction to Massive Point Cloud Data Processing
Visualizing massive point clouds used to be a real headache. If you struggle to handle massive point clouds – I’m talking billion-point scale – or massive 3D meshes with many triangles, handling various file formats, and you don’t have the coding skills to automate everything, then I have a solution for you. This quick tutorial shows how to start handling and visualizing this data quickly on your local machine.
We now have unique tools that make it easy and fast, even without coding. This opens up a world of possibilities for sharing and collaborating on 3D data, even with people who aren’t tech-savvy.
This article details how to use three robust no-code solutions: the command-line interface (CLI), CloudCompare, and Potree Desktop. These powerful tools allow you to explore and visualize large-scale 3D data without extensive coding skills.
When you are ready, let us dive right in!
🗝️ Key Takeaways
- Command-line tools offer a powerful yet simple way to convert point cloud data.
- CloudCompare is a versatile viewer for quick visualization and basic analysis.
- PotreeConverter creates web-ready point clouds for easy sharing and online exploration.
- Potree Desktop allows visualization of massive point clouds on your local machine.
- Combining these tools provides a comprehensive no-code workflow for handling large point clouds.
The Workflow to Manage Massive Point Clouds
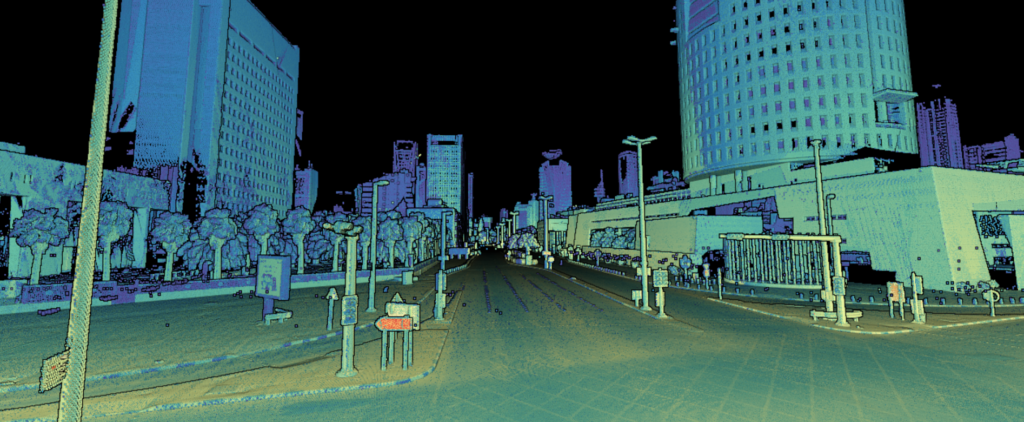
Let’s explore the world of 3D point clouds and 3D meshes. These massive datasets hold incredible potential for various applications, from urban planning to heritage preservation. The ability to analyze and manipulate these complex datasets is revolutionizing industries, making 3D point clouds and meshes essential tools in our increasingly digital and spatially aware world.
🦧 A Word on Applications: In urban planning, they accurately represent existing structures, enabling planners to visualize proposed developments in a realistic context. In heritage preservation, 3D point clouds and meshes allow for detailed documentation of historical sites, facilitating restoration efforts and ensuring that significant cultural landmarks are preserved for future generations. The integration of these datasets with virtual and augmented reality is also creating new opportunities for immersive experiences in education, tourism, and more.
But working with them-especially like the one below-can be a daunting task.
Let us simplify the process by working in 5 Steps. But, first, what is our toolset?
Pre-requisites for massive point clouds no-code solution:
What do we need? We have three prerequisites. First is the command-line interface (CLI) – we will use Windows in this case. We’ll type some commands. Second, we need CloudCompare. Go to the CloudCompare webpage, download the version that suits you, and you’ll be ready. Third, we need Potree and its desktop variant. Don’t worry; I’ll show you how to get and install it. With that setup, we’re good to go.
- A command line (terminal or PowerShell)
- CloudCompare (download from https://www.danielgm.net/cc/)
- Potree (we’ll guide you through the setup process)
Step 1: Understanding Point Cloud Formats
Point clouds are collections of 3D points, each representing a specific location in space. They come in various formats, including:
- .las: A popular format for storing point clouds, often used for LiDAR data.
- .laz: A compressed version of the .las format, ideal for large datasets.
- .ply: Another common format, often used for 3D meshes.
- .xyz: A simple text-based format that stores coordinates (x, y, z) for each point.
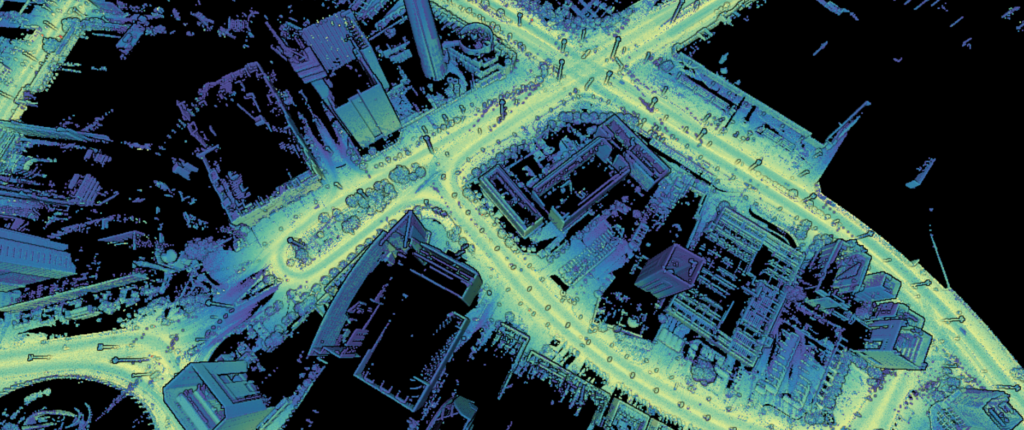
I’ll use a city-scale dataset as an example.
Before diving into visualization, let’s quickly discuss file formats. Point cloud data comes in various formats like E57, LAS, LAZ, PLY, TXT, and even OBJ (typically for meshes, but applicable here for demonstration). For efficient storage and processing, converting to LAS or LAZ is recommended. LAZ offers better compression.
For this tutorial, we’ll focus on converting to .las and .laz formats.
The idea to achieve this, is to do some file conversion. This is our second stage.
Step 2: File Format Conversion
The goal is to perform file conversion using the command line. We will convert any of these formats to LAS or LAZ. To do this, open your command prompt (CMD on Windows). First, navigate to the CloudCompare installation directory using the cd command (change directory). In my case, the command is cd C:\Program Files\CloudCompare.
Once in the correct directory, you can execute CloudCompare commands. The basic structure is
CloudCompare -O -GLOBAL_SHIFT AUTO -SAVE_CLOUDS FILE This command opens the specified input file, applies a global shift to handle large coordinates, and saves the output in LAS format. You can replace .las with .laz for better compression.
For example, to convert a PLY file named sample.ply to LAS:
CloudCompare -O sample.ply -GLOBAL_SHIFT AUTO -SAVE_CLOUDS FILE sample.las This process is also applicable to meshes. To convert a mesh to a point cloud, use a similar command:
CloudCompare -O -SAMPLE_MESH POINTS 1000000 -SAVE_CLOUDS FILE This samples the mesh with one million points and saves it as a LAS file.
Step 2 (Bonus): Alternative File Format Conversion Methods
Lastools: File Conversion (massive point clouds to .las / .laz)
LAStools is a suite of command-line tools for processing LiDAR data (Light Detection and Ranging). It offers a wide range of functionalities, including:
- Conversion: Converting between different LiDAR file formats (e.g., LAS, LAZ, XYZ, ASCII)
- Filtering: Removing noise, outliers, or specific point types
- Classification: Assigning labels to points based on their attributes (e.g., ground, vegetation)
- Editing: Modifying point attributes or geometry
- Analysis: Calculating metrics like density, height, and slope
Link: https://lastools.github.io/
To achieve the conversion, you can proceed as follows:
- Open your command line and navigate to the directory containing LAStools.
- Use the
las2lascommand to convert your point cloud: Bashlas2las -i input_file.xyz -o output_file.las - For compression, use
las2las -i input_file.las -o output_file.laz
Meshlab (for 3D Mesh to Massive Point Clouds)
MeshLab is a free and open-source software for processing and editing 3D triangular meshes. (Link: https://www.meshlab.net/). To execute some mesh sampling, you can do the following:
- Open your 3D mesh in MeshLab.
- Go to Filters > Sampling > Point Cloud.
- Adjust the sampling density as needed and export the point cloud as a .las file.
Now, let’s address the challenge of visualizing truly massive point clouds.
Step 3: Massive Point Cloud Visualization with Potree
Direct viewing can be slow.
- For datasets under 250 million points: Use CloudCompare for its user-friendly interface and efficient handling of smaller datasets.
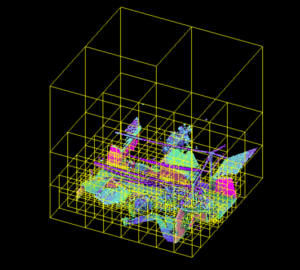
- For datasets over 250 million points: Potree is better suited for handling large-scale point clouds due to its octree-based structure.
Let me quickly talk about how the octree structure comes into play.
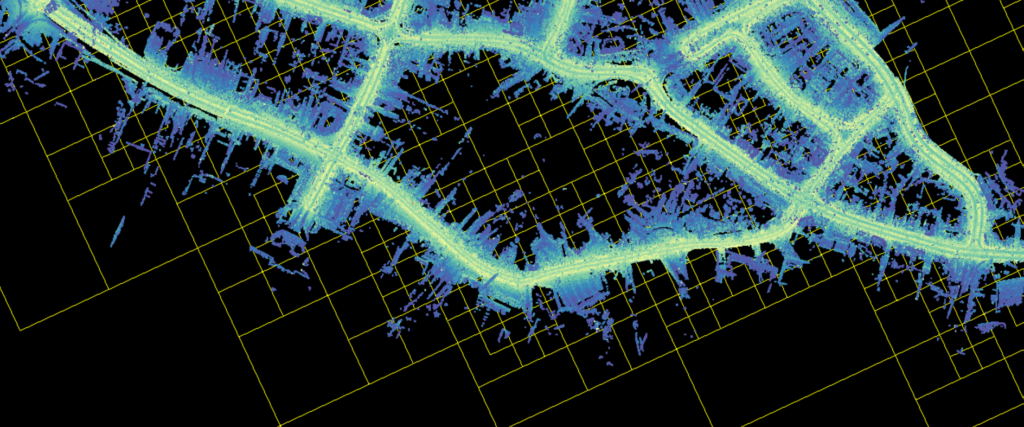
The octree efficiently organizes point cloud data by subdividing it into smaller cubes (eight per level). Only the cubes necessary for the current view are loaded, significantly improving performance.
🦚 Note: Potree utilizes a variant called a modified nested octree. Points are stored at every level of the octree. This ensures smoother transitions between levels of detail, avoiding abrupt changes in point density as you navigate the point cloud.
To create this octree structure, we’ll use PotreeConverter. This tool is included in the Potree project. Download Potree Desktop (https://github.com/potree/potree-desktop/releases/), unzip it, and you’ll find a folder containing the necessary files. Open the potree.bat application to launch Potree Desktop.
Open the directory containing your LAS or LAZ file. Drag and drop the file into the Potree Desktop window. PotreeConverter will automatically convert the file into the modified nested octree format. This involves indexing the points and creating a dedicated folder with the required files for web viewing. After conversion, the point cloud will be displayed in Potree Desktop.
🦚 Note: This method is particularly beneficial for point clouds exceeding 250 million points. For smaller datasets, CloudCompare can handle direct loading. Drag and drop the file into CloudCompare for a quick overview.
Step 4. CloudCompare Point Cloud Editing
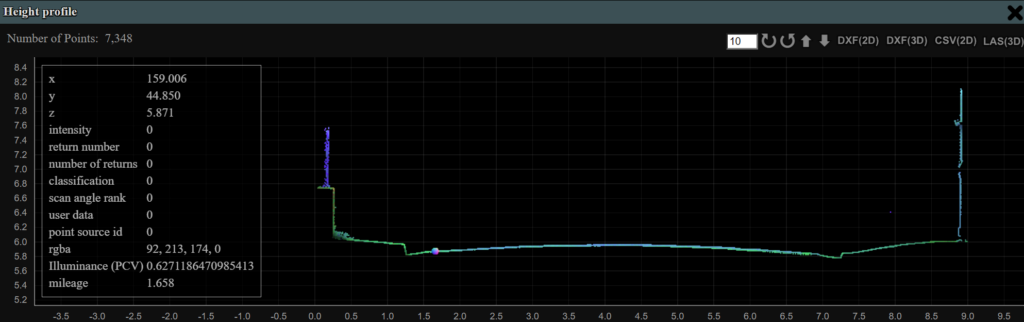
CloudCompare also offers various analysis tools. The profile tool is especially helpful. Define two points to create a cross-section. Adjust the width of the profile, visualize it in 2D, and export the selection to LAS or LAZ. This exported profile can then be used for further analysis, such as feature computation, within CloudCompare.
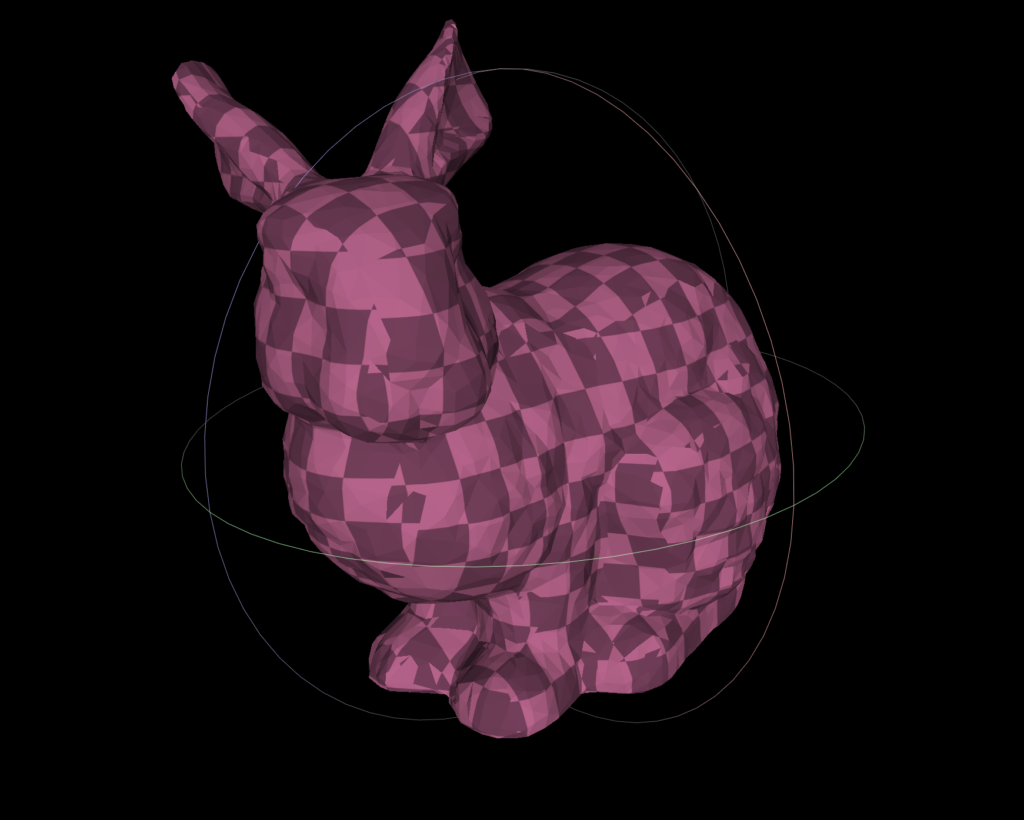
Now, let’s look at the Stanford Bunny mesh example. Load the OBJ file directly into CloudCompare. We have already shown how to convert this mesh to a point cloud.
Step 5. Potree: Massive Point Cloud Tricks
Potree Desktop offers several controls. You can switch between displayed point clouds and attributes. It provides measurement tools. Classification flags, if present in the data, are also accessible. This makes Potree Desktop very useful for visually profiling the data.
The Potree Desktop navigation controls allow intuitive exploration of the point cloud. You can adjust the navigation speed and style to suit your needs. While loading speed is influenced by your hard drive type (SSD recommended for large datasets), the overall performance is impressive.
Conclusion
This strategy can load and visualize even large, multi-gigabyte point clouds rapidly.
With this approach, you can quickly assess your point cloud, create profiles, and export selections for further processing in CloudCompare. CloudCompare, in turn, enables detailed analysis and feature computation, like calculating the number of neighbors within a specified radius, planarity, and verticality. These computed features can then be used for tasks like classification or other advanced processing steps.
So, without extensive coding beyond some basic command-line instructions, you have a streamlined workflow for visualizing, analyzing, and handling large 3D datasets. The next step would be to automate this process. This typically involves scripting with Python, which is covered in more detail in dedicated Python tutorials focused on automating point cloud processing workflows.
This strategy can load and visualize even large, multi-gigabyte point clouds rapidly. It offers smooth navigation and rendering. You can also change the default rendering attribute, such as intensity gradient.
Next Steps
- Automation: Learn how to automate the conversion and processing of point clouds using scripting languages like Python.
- Advanced Techniques: Explore CloudCompare and Potree’s more advanced features, such as point cloud registration and 3D modeling.
This is where the courses 3D Segmentor OS and 3D Deep Learning can help you on the journey.
🦚 Note: If you are new to Python, 3D, or AI, I highly recommend going with 3D Segmentor OS. If, on the other hand, you are a researcher with experience with Python, the 3D Deep Learning Course should be the best fit.
Additional Resources
- PotreeConverter: https://github.com/potree/PotreeConverter
- CloudCompare: https://www.danielgm.net/cc/
- Potree Desktop: https://github.com/potree/potree-desktop/releases
- LAStools: https://rapidlasso.com/lastools/ – A powerful set of command-line tools for processing LiDAR data.
- Entwine: https://entwine.io/ – Another excellent tool for preparing point cloud data for web visualization.
Other 3D Tutorials
You can pick another Open-Access Tutorial to perfect your 3D Craft.
- 3D Point Cloud Labeling from Photos with Python (and why AI can’t design it for you)
- 3D Pipeline Architecture: A Founder’s Blueprint
- Multi-View Engine for 3D Generative AI Models (Python Tutorial)
- 3D Scene Graphs for Spatial AI with NetworkX and OpenUSD
- 3D Reconstruction Pipeline: Photo to Model Workflow Guide
- Synthetic Point Cloud Generation of Rooms: Complete 3D Python Tutorial
- 3D Generative AI: 11 Tools (Cloud) for 3D Model Generation
- 3D Gaussian Splatting: Hands-on Course for Beginners
- Building a 3D Object Recognition Algorithm: A Step-by-Step Guide
- 3D Sensors Guide: Active vs. Passive Capture