Learn to build intelligent 3D scene graphs from point clouds using Python, NetworkX, and OpenUSD. Complete tutorial access with LLM integration for spatial AI.
The hardest part of spatial AI isn’t capturing the data.
It’s making that data actually intelligent. You’ve got millions of perfectly labeled 3D points, but when you try to build something that thinks about space, you hit a wall.
Your point clouds are beautiful. They’re also completely dumb.
🎼 Note: This tutorial is offered to you as part of my goal to open 99% of my work. To support this vision while joining the top 0.1% of 3D Experts, you can download an Operating System to specialize in 3D Reconstruction, 3D Data Processing, or 3D Deep Learning.
Have a great read 📜
The Hidden Problem with 3D Data
Your LiDAR system captures every surface detail. Your ML pipeline labels every point with surgical precision. Yet your autonomous system still can’t answer: “Which chairs are positioned for conversation?”
This isn’t a hardware problem. It’s an intelligence architecture problem.
Point clouds store coordinates and colors. Meshes store vertices and faces. None of these formats encode what matters most for spatial AI: how objects relate to each other.
Modern AI systems need to understand that the lamp sits ON the table, the chair is ADJACENT to the desk, and the bookshelf is AGAINST the wall. These relationships unlock the spatial reasoning that separates truly intelligent systems from glorified navigation algorithms.
🌱 Florent’s Note: The semantic segmentation revolution solved object recognition, but it didn’t solve spatial understanding. That requires a completely different approach.
What 3D Scene Graphs Actually Solve
Scene graphs transform passive geometry into active knowledge. They capture not just what objects exist, but how they interact and define functional spaces.
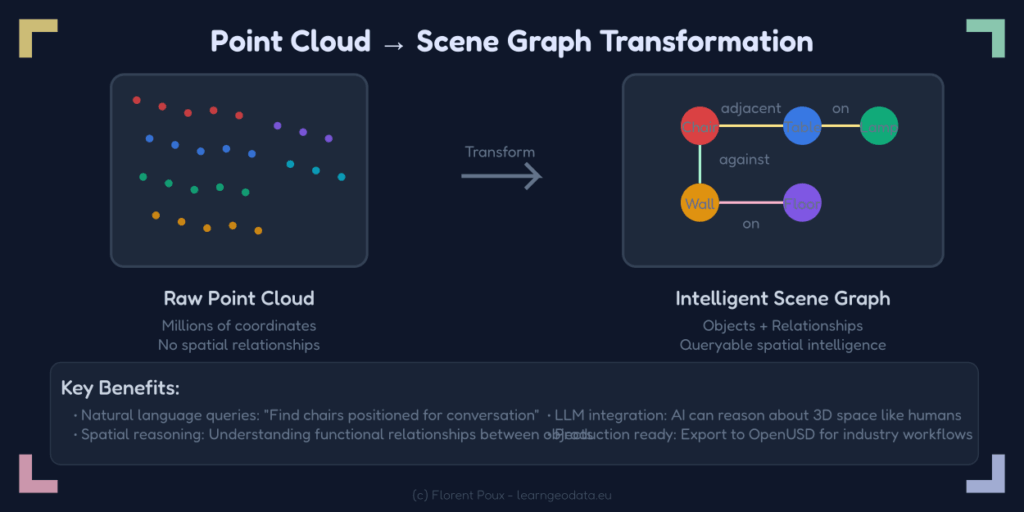
Think about how you understand a room. You don’t see millions of individual points. You see furniture arrangements, conversation areas, and functional zones. Scene graphs encode this human-like spatial reasoning into queryable data structures.
The breakthrough comes from treating space as a network rather than a container. Traditional approaches ask “what’s at coordinate X,Y,Z?” Scene graphs ask “how does object A relate to object B?”
This shift enables the complex spatial reasoning that autonomous systems actually need.
🌱 Florent’s Note: NetworkX provides the graph infrastructure, while custom algorithms determine relationship types based on geometric analysis. The combination is powerful.
The LLM Integration for 3D Scene Graphs
This is where scene graphs become truly revolutionary. Large language models transform technical graph data into natural conversation.
Users can ask: “Which packages are stacked and safe to pick?” or “What’s the clearest path to the loading dock?”
No graph theory knowledge required. No complex 3D software interfaces. Just natural questions with intelligent answers.
The integration works through structured prompt engineering that converts graph relationships into text descriptions LLMs can understand and reason about.
🦥 Geeky Note: The key is balancing geometric precision with natural language flexibility. Temperature settings around 0.5 work well for spatial reasoning tasks.
Transform Your Point Clouds Into 3D Scene Graphs
3D Scene graphs aren’t magic bullets. They excel at structured environments with clear object boundaries. They struggle with fluid dynamics, particle systems, and highly organic shapes where discrete objects don’t exist.
The approach also assumes quality semantic labeling. Poor input data creates phantom relationships and missing connections that break spatial reasoning. Garbage in, garbage out applies ruthlessly here.
But for indoor environments, robotics applications, and digital twins? Scene graphs are transformative.
The hardest part of building spatial AI isn’t capturing 3D data.
It’s making that data actually understand relationships. Your semantic point clouds know there’s a “chair” at coordinates X,Y,Z, but they don’t know that chair is positioned for conversation with the nearby table.
What You’ll Build
A complete pipeline that transforms static point clouds into intelligent scene graphs. Your system will automatically discover spatial relationships—lamps ON tables, chairs ADJACENT to desks, bookshelves AGAINST walls—then integrate with LLMs for natural language spatial queries.
The 6-Stage Pipeline for 3D Scene Graphs
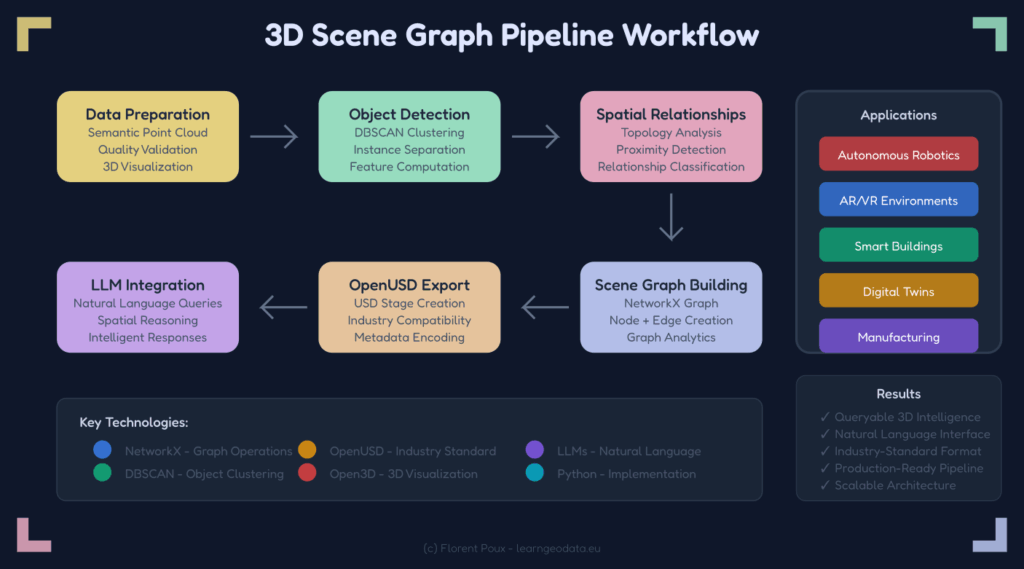
The workflow progresses through systematic intelligence extraction:
- Data Preparation – Clean semantic point clouds with quality validation
- Object Detection – DBSCAN clustering separates individual object instances
- Spatial Relationships – Geometric analysis discovers how objects connect
- Scene Graph Building – NetworkX creates queryable spatial knowledge structures
- OpenUSD Export – Industry-standard format for production compatibility
- LLM Integration – Natural language interfaces for spatial reasoning
The Technical Foundation
The implementation pipeline transforms raw point clouds through systematic intelligence extraction:
- Object Detection: DBSCAN clustering separates individual items from semantic soup
- Relationship Analysis: Geometric tests discover spatial connections
- Graph Construction: NetworkX weaves everything into queryable structures
- Export: OpenUSD format ensures industry compatibility
- LLM Integration: Natural language interfaces for spatial reasoning
Each stage adds intelligence layers that traditional 3D formats simply can’t capture.
🌱 Florent’s Note: The beauty is in the modularity. You can customize algorithms without breaking the overall pipeline. Start simple, then optimize for your specific use case.
The 3D Scene Graphs + Spatial AI Materials
Your point clouds don’t have to stay dumb forever. Scene graphs represent the future of intelligent 3D data structures that actually understand space the way humans do.
The teams building spatial intelligence today are defining how we’ll interact with 3D environments tomorrow. The question isn’t whether you’ll adopt scene graphs—it’s whether you’ll lead the transition or follow later.
Want to see exactly how it’s done?
Access the complete hands-on tutorial + materials:
🎁 Build 3D Scene Graphs for Spatial AI LLMs from Point Cloud (Python Tutorial).
You’ll get production-ready Python code, sample datasets, step-by-step implementation guides, and everything you need to transform your point clouds into spatial intelligence. Your autonomous systems deserve data structures that actually think about space.
Open-Access Tutorials
You can continue learning standalone 3D skills through the library of 3D Tutorials
Latest Tutorials
- 3D Reconstruction Complete Guide
- LiDAR and Point Cloud Processing Complete Guide
- 3D Spatial AI The Complete Guide
- Point Cloud Level of Detail in Python: Octrees, Frustum Culling, and Out-of-Core Rendering
- Open-Vocabulary 3D Semantics in Python: SAM, CLIP, and DINOv2 (No Training)
Instant Access to Entire Learning Program (Recommended)
If you want to make sure you have everything, right away, this is my recommendation:
Cherry Pick a single aspect
If you want to make sure you have everything, right away, this is my recommendation (ordered):
1. Get the fundamental 3D training (3D Bootcamp)
1. 3D Reconstruction (The Reconstructor OS)
Frequently Asked Questions (FAQ) on 3D Scene Graphs
3D scene graphs are structured representations that encode objects and their spatial relationships in 3D environments. Unlike traditional point clouds that only contain coordinates, scene graphs capture semantic meaning and spatial intelligence, enabling AI systems to reason about 3D spaces like humans do.
Object extraction from 3D point clouds typically uses clustering algorithms like DBSCAN. After semantic labeling, DBSCAN groups spatially connected points with identical labels (e.g., all “chair” points) into distinct object instances, separating multiple chairs in a room.
NetworkX is a Python library for creating and analyzing complex networks and graphs. For 3D scene graphs, it provides the infrastructure to represent objects as nodes and spatial relationships as edges, enabling efficient querying and analysis of spatial intelligence.
Integration involves converting NetworkX scene graphs into structured text representations that preserve spatial relationships. LLMs can then process these descriptions to answer natural language queries about 3D spaces, like “find all chairs near windows” or “identify cluttered areas.”
OpenUSD (Universal Scene Description) is an industry-standard framework for 3D scene representation originally developed by Pixar. Exporting to USD makes scene graphs compatible with production pipelines, enabling use in professional 3D applications, robotics, and simulation systems.
Key applications include autonomous robotics (spatial navigation and understanding), smart buildings (space optimization and facility management), AR/VR environments (intelligent object placement), and digital twins (queryable 3D facility models).
Essential libraries include NetworkX (graph operations), scikit-learn (DBSCAN clustering), Open3D (3D visualization), pandas (data handling), numpy (numerical operations), and optionally OpenUSD libraries for industry-standard export.
Spatial relationships are computed through geometric analysis of object bounding boxes and centroids. Algorithms check for containment (one object inside another), adjacency (objects touching or very close), and relative positioning (above, below, near) using distance thresholds and 3D coordinate comparisons.
Other References: 3D Scene Graphs and Spatial AI
TO be thorough and help you in your innovations, here is a selection of papers, documentation and tools.
Academic Papers & Research
Core Scene Graph Research
- “3D Scene Graph: A Structure for Unified Semantics, 3D Space, and Camera” – ICCV 2019
https://openaccess.thecvf.com/content_ICCV_2019/papers/Armeni_3D_Scene_Graph_A_Structure_for_Unified_Semantics_3D_ICCV_2019_paper.pdf - “Learning 3D Semantic Scene Graphs from 3D Indoor Reconstructions” – CVPR 2020
https://openaccess.thecvf.com/content_CVPR_2020/papers/Wald_Learning_3D_Semantic_Scene_Graphs_From_3D_Indoor_Reconstructions_CVPR_2020_paper.pdf
Spatial AI & LLM Integration
- “SG-Nav: Online 3D Scene Graph Prompting for LLM-based Zero-shot Object Navigation” – NeurIPS 2024
https://proceedings.neurips.cc/paper_files/paper/2024/file/098491b37deebbe6c007e69815729e09-Paper-Conference.pdf - “Open3DSG: Open-Vocabulary 3D Scene Graphs from Point Clouds” – arXiv 2024
https://arxiv.org/abs/2402.12259 - “3DGraphLLM: Combining Semantic Graphs and Large Language Models for 3D Scene Understanding” – arXiv 2024
https://arxiv.org/abs/2412.18450
Point Cloud Processing & Semantic Segmentation
- “PointNet: Deep Learning on Point Sets for 3D Classification and Segmentation” – CVPR 2017
https://openaccess.thecvf.com/content_cvpr_2017/papers/Qi_PointNet_Deep_Learning_CVPR_2017_paper.pdf - “PointNet++: Deep Hierarchical Feature Learning on Point Sets in a Metric Space” – NeurIPS 2017
https://proceedings.neurips.cc/paper/2017/file/d85b63ef0ccb114d0a3bb7b7d808028f-Paper.pdf
Official Documentation & Tools
NetworkX – Graph Analysis Library
- NetworkX Official Documentation
https://networkx.org/documentation/stable/ - NetworkX Tutorial – Getting Started
https://networkx.org/documentation/stable/tutorial.html - NetworkX Algorithms Reference
https://networkx.org/documentation/stable/reference/algorithms/index.html
OpenUSD – Universal Scene Description
- OpenUSD Official Documentation
https://openusd.org/release/index.html - USD Python API Reference
https://openusd.org/release/api/index.html - NVIDIA OpenUSD Resources
https://developer.nvidia.com/usd
Python Libraries & Frameworks
- Open3D – 3D Data Processing Library
http://www.open3d.org/docs/release/ - scikit-learn – DBSCAN Clustering Documentation
https://scikit-learn.org/stable/modules/generated/sklearn.cluster.DBSCAN.html - pandas – Data Manipulation Library
https://pandas.pydata.org/docs/
Industry Standards & Frameworks
3D Graphics & Visualization Standards
- Khronos Group – Open Standards for 3D Graphics
https://www.khronos.org/ - glTF 2.0 Specification – Runtime 3D Asset Delivery
https://registry.khronos.org/glTF/specs/2.0/glTF-2.0.html
Robotics & Autonomous Systems
- ROS (Robot Operating System) Documentation
https://docs.ros.org/ - Open Robotics – Simulation & Development Tools
https://www.openrobotics.org/
Computer Vision Benchmarks
- ScanNet – 3D Scene Understanding Benchmark
http://www.scan-net.org/ - S3DIS – Stanford 3D Indoor Scene Dataset
http://buildingparser.stanford.edu/dataset.html
Professional Learning Resources
O’Reilly Media – Technical Books
- “3D Data Science with Python” by Florent Poux
https://www.oreilly.com/library/view/3d-data-science/9781098161323/ - “Hands-On Machine Learning” by Aurélien Géron
https://www.oreilly.com/library/view/hands-on-machine-learning/9781492032632/
Educational Platforms
- 3D Geodata Academy – Specialized 3D Data Science Training
https://learngeodata.eu/ - Coursera – Machine Learning Specialization
https://www.coursera.org/specializations/machine-learning-introduction - MIT OpenCourseWare – Computer Vision
https://ocw.mit.edu/courses/6-801-machine-vision-fall-2020/
Research Conferences & Venues
Computer Vision Conferences
- IEEE Conference on Computer Vision and Pattern Recognition (CVPR)
https://cvpr.thecvf.com/ - International Conference on Computer Vision (ICCV)
https://iccv2023.thecvf.com/ - European Conference on Computer Vision (ECCV)
https://eccv2024.ecva.net/
Robotics & AI Conferences
- International Conference on Robotics and Automation (ICRA)
https://www.ieee-ras.org/conferences-workshops/fully-sponsored/icra - Conference on Neural Information Processing Systems (NeurIPS)
https://nips.cc/ - International Conference on Machine Learning (ICML)
https://icml.cc/
Open Source Projects & Code Repositories
3D Scene Graph Implementations
- Open3D – 3D Data Processing
https://github.com/isl-org/Open3D
Point Cloud Processing Tools
- PCL – Point Cloud Library
https://pointclouds.org/ - CloudCompare – 3D Point Cloud Processing
https://www.cloudcompare.org/
Graph Neural Networks
- PyTorch Geometric – Graph Neural Network Library
https://pytorch-geometric.readthedocs.io/ - Deep Graph Library (DGL)
https://www.dgl.ai/

