

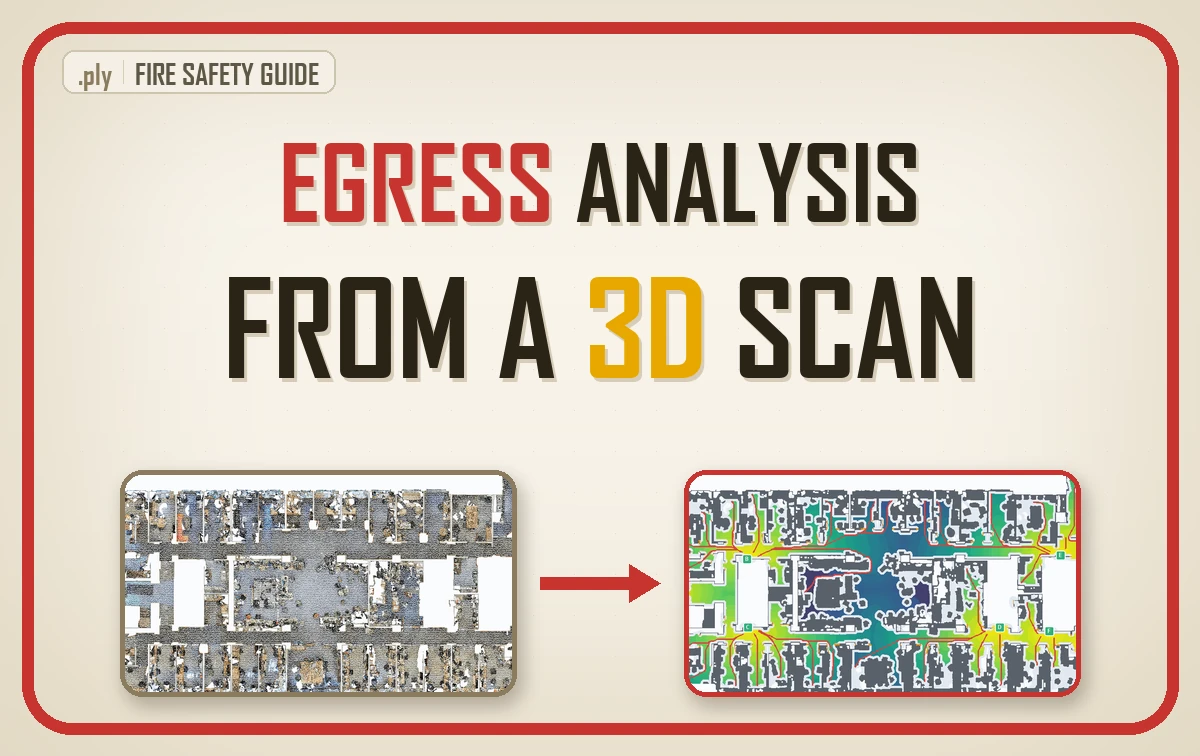
Fire safety analysis of a floor, which code professionals call egress analysis, checks that every occupant can reach an exit: the walk to the closest exit, the common path, dead-end corridors and exit capacity, each read against the governing code. A 3D scan measures them on the building as it stands, and the evacuation plan is drawn from that result.
| What it is | Measuring how far, and by which way, every spot on a floor is from an exit that actually works |
| What you get | A walking distance map, a route per room, a list of dead ends and common paths, a blocked-exit table and a posted plan |
| Codes it reads against | IBC 2021 chapter 10, NFPA 101, UK Approved Document B, with ISO 23601 for the posted plan |
| Worked on | A scanned university office floor: 33 spaces, 8 exits and 296 m² of floor where a body fits |
| Level | Fire engineers, facility and safety managers. No code needed to follow it. |
On a scanned office floor, no single blocked exit added more than 2.9 m to the worst walk. With exit B already closed, losing E alone left that walk at 27.1 m, and losing E and G together took it to 50.0 m. A posted plan checked only against its drawing says nothing about the pair of doors a floor cannot lose, and only a blocked-pair test, rerun after every fit-out, finds them.
So, let us talk about getting out of a building. I will keep the code tables short and spend the time where a scan changes the answer, because one test in here surprised me on a floor I thought I understood: close two doors at once and see what happens.
- What a Fire Safety and Egress Analysis Checks
- Travel Distance, Common Path and Dead End Limits by Code
- Prescriptive Egress Checks Versus Evacuation Simulation
- Why As-Built Reality Breaks Egress Assumptions
- What a Scan-Based Egress Analysis Measures
- The Blocked Exit Test Every Building Manager Should Run
- What a Posted Evacuation Plan Must Show
- Keeping Egress Current in a Fire Safety Digital Twin
- Own Your Egress Analysis Instead of Ordering It Again
- Frequently Asked Questions About Egress Analysis
When I want to explain why an evacuation sign is not a floor plan, I go back to a map every Londoner has held.
In 1931 a draughtsman called Harry Beck, who had spent years drawing technical diagrams for the London Underground’s signal engineers, showed his employer a Tube map that ignored geography. According to the London Museum, he did not bother making it geographically accurate and drew the connections instead; after a trial in 1932 it went into print in 1933.
I love that story because it splits two jobs people keep merging. One is the analysis, which needs geometry down to the centimetre. The other is the sign by the door, which needs a frightened person to understand it in four seconds.
Robotics has just relearned Beck’s lesson. In May 2026, Yifan Du and colleagues posted Beyond Geometry, a navigation method for 3D indoor scenes that keeps only the floor a body can actually reach, judged by ground support, headroom and connectivity, and they report a search space more than 80 percent smaller with all 300 planning queries solved. An evacuation plan needs that same map: not every wall, but which floor connects to which door.
Egress Analysis on a 3D Scan
Egress analysis on a 3D scan is the first of those jobs done on the building you actually have. Partitions move, a store room becomes a lab, a corridor slowly fills with cabinets. The drawing in the fire strategy rarely follows. A laser scan does, because it records what is there on the day somebody walks through with the scanner.
So in this guide I will stay on the decisions: what the analysis checks, what the codes say, where a scan earns its place, and what you should demand before anyone signs anything.
🦚 Florent’s Note: Every number about a real floor in this guide comes from one run: my P24 evacuation tutorial on Area 1 of the Stanford S3DIS dataset, a scanned office floor of 33 spaces and 8 exits. I quote what that code measured, and I say so each time. The code limits are quoted from the codes themselves and are illustrative, never a compliance verdict.
By the end you can judge these five things for yourself
- Name the four things an egress analysis measures and which professional owns each
- Read travel distance, common path and dead-end limits in IBC 2021 and Approved Document B without mixing them up
- Decide when prescriptive checks are enough and when RSET against ASET is the real question
- Specify a scan-based egress analysis that reports its own uncertainty
- Run a blocked exit test and turn it into a quarterly management habit
What a Fire Safety and Egress Analysis Checks
Egress analysis is the unglamorous half of Beck’s split, the one measured in centimetres. His map is the reward at the end.
An egress analysis checks four things on every floor: how far people walk to an exit, how long they walk before a second way out opens up, whether any corridor traps them, and whether the doors can pass everyone in time. Three of those are distances. The fourth is capacity, which turns door width and occupant count into a flow.
Let me make the distances concrete, because the words get used loosely even by people who should know better.
- Travel distance is the walk from the farthest point of a space to an exit, along the route a person can actually take around walls and furniture.
- Common path is the stretch someone walks before a second, independent way out becomes available. Any office with a single door has one.
- A dead-end corridor offers one way in and the same way back, with no exit at its far end.
- Exit capacity compares the width of doors and stairs with the number of people the floor holds.
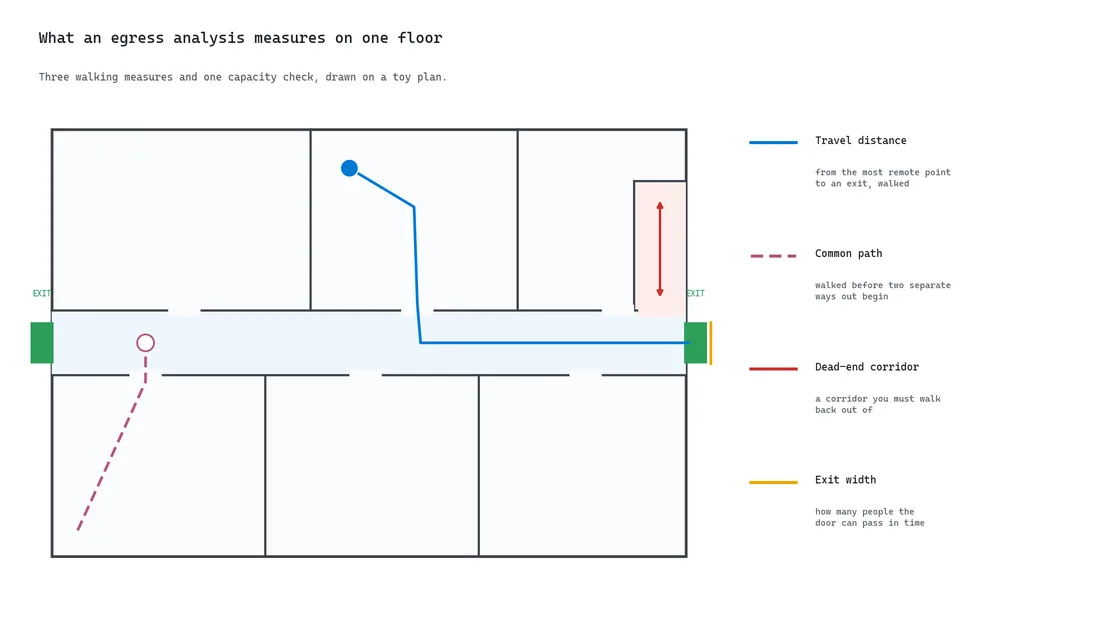
The split matters for who does what. A scan measures the three distances very well. Capacity also needs occupant numbers and door hardware, which no point cloud contains, so it stays with the fire engineer and the occupancy schedule.
Travel Distance, Common Path and Dead End Limits by Code
Egress limits are numbers, so here are only the ones the code documents actually print. Read them as a shape, because the shape travels between codes and the figures do not.
Travel distance, common path and dead-end limits differ by code, by occupancy and by whether the building has sprinklers, which is why a number lifted from one code is meaningless in another. Here are the figures for an office floor, quoted from the documents themselves, so you can see the shape of the rules.
I started my reading with the American model code, since so many jurisdictions build on it.
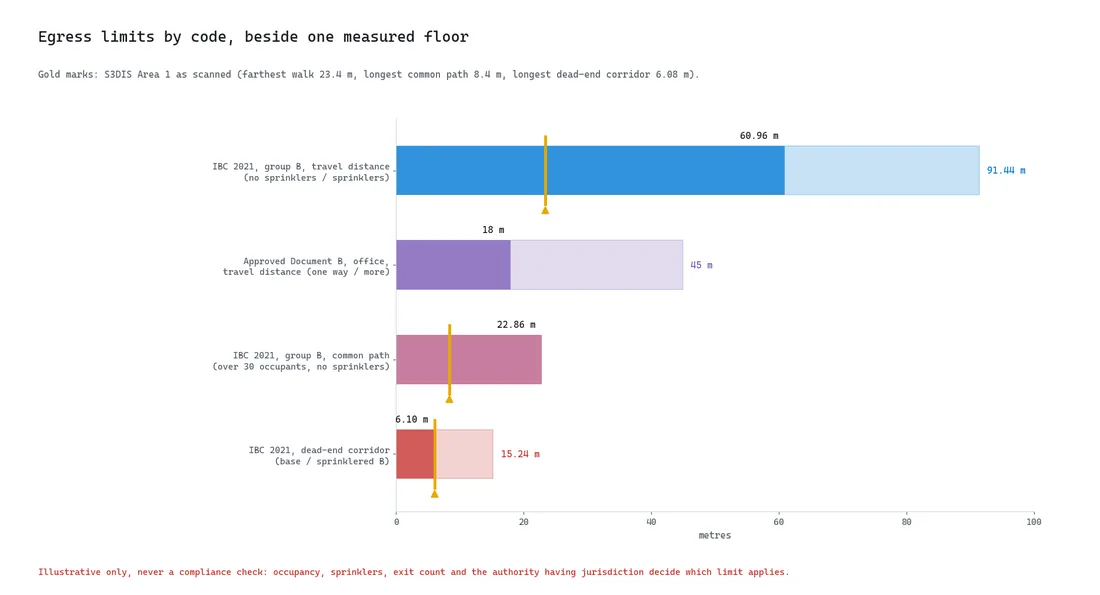
The International Building Code 2021, chapter 10 allows a business occupancy (group B) an exit access travel distance of 60.96 m (200 ft) when the building has no sprinklers, rising to 91.44 m (300 ft) when it does. Dead-end corridors stop at 6.10 m (20 ft), or 15.24 m (50 ft) on a sprinklered group B floor, and common path stops at 22.86 m (75 ft) for an unsprinklered group B floor with over 30 occupants.
The English rules measure the same walk with another logic. Approved Document B Volume 2 sets its limits by direction of travel. Its Table 2.1 gives an office 18 m where travel is possible in one direction only and 45 m where it is possible in more than one. Two routes count as alternatives only when they leave in directions at least 45 degrees apart, or are separated by fire-resisting construction.
Back across the Atlantic, there is a second document I had to read alongside the IBC. In the United States, NFPA 101, the Life Safety Code, regulates the same three distances by occupancy chapter, and many jurisdictions adopt it beside or instead of the IBC. The geometry you measure is identical. The limit you compare it to depends on which document the authority having jurisdiction enforces.
🦥 Geeky Note: Approved Document B has a quiet line that explains why scans matter. Note 1 under Table 2.1 says that when the internal layout of partitions and fittings is not known, you assess direct distance instead, assumed to be two-thirds of the actual travel distance. A scan removes that guess: the layout is known, so the real walk replaces the straight line.
Prescriptive Egress Checks Versus Evacuation Simulation
For some months now I have had an experienced tennis coach, and it is incredible how we overlook the fast lane of finding an expert and just following. On a conventional floor, the prescriptive code tables are that expert; evacuation simulation is for the day your design leaves the ground they cover.
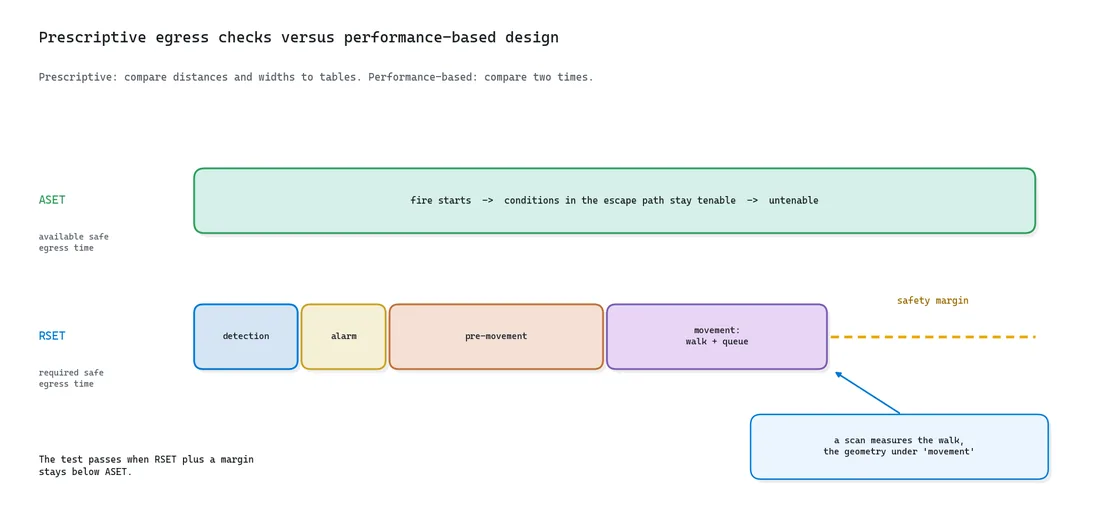
Prescriptive egress checks compare measured distances and widths with tables, while performance-based design compares two times: the time people need to get out and the time conditions stay survivable. Engineers call them RSET, the required safe egress time, and ASET, the available safe egress time. A design passes when RSET plus a safety margin stays below ASET.
RSET is a sum. Detection, then the alarm, then pre-movement (the minutes people spend finishing an email or looking for a colleague), then movement, which is walking plus queuing at doors and stairs. Fire and smoke modelling produces ASET. When I checked what engineers actually cite for both halves, two names kept coming back: the SFPE Handbook and ISO/TR 16738.
Simulation tools exist for the movement part, and when I wanted to know how many, I found that NIST had already done the counting. The review by Kuligowski, Peacock and Hoskins, A Review of Building Evacuation Models, 2nd Edition, covers 26 computer evacuation models and lists whether each can import CAD drawings. That detail is the whole point of this article. A simulation fed an outdated drawing produces an outdated answer with many decimals.
Prescriptive checks suffice for a conventional layout that sits comfortably inside the tables. Performance-based analysis comes in when a design departs from the tables, such as an atrium, a long open floor or a phased refurbishment. Both start from the same geometry, and that geometry should be the as-built one.
🪐 System Thinking Note: Walking speed is a design value, not a fact about your occupants. The number I keep checking it against is an old one: Fruin’s classic pedestrian study, Designing for Pedestrians, puts the normal mean walking speed at about 250 ft per minute (1.27 m/s). My run converts distance to time at 1.2 m/s. Treat any “seconds to exit” figure as distance in disguise, since crowds, stairs and smoke all slow people far below it.
Why As-Built Reality Breaks Egress Assumptions
The gap between as-built reality and egress assumptions is the part I find unsettling, because nothing in it looks like an emergency until the day it is one.
As-built reality breaks egress assumptions because buildings change continuously and fire strategies are updated rarely. A partition added during a fit-out can turn a two-way corridor into a dead end. A badged door can delete an exit from the evacuation for every visitor. A row of filing cabinets can narrow a corridor below the width the drawing promised.
None of those changes is dramatic. That is what makes them dangerous. Nobody files a planning application for a cabinet, and the fire strategy goes on describing a corridor that no longer exists.
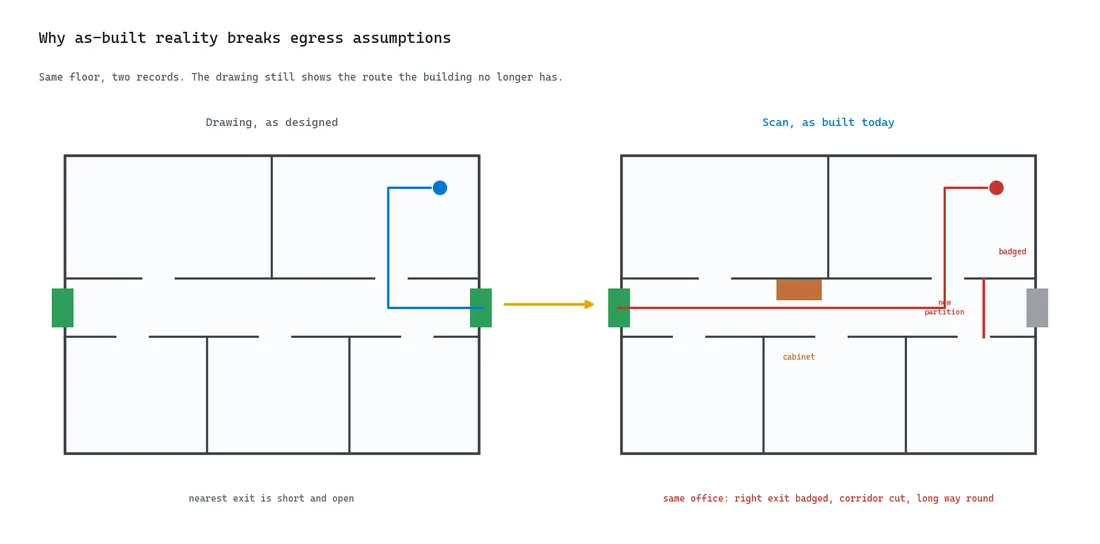
A scan closes the gap because it measures what is there, cabinets included. A mobile scanner walking a floor at normal pace records walls, doors, furniture and clutter in one pass, and the egress analysis then reads its distances from that record instead of from the plan in the file.
There is a catch, and you should hear it from me rather than from your first project. A raw scan knows where surfaces are, not what they are. Before any walking distance exists, every point has to be sorted into floor, wall, door or obstacle, and doors have to be cut open. That understanding step is where the real work sits.
What a Scan-Based Egress Analysis Measures
A scan-based egress analysis is easiest to judge on one real office floor, so here is what that floor said once the scan was classified and the exits were declared.
A scan-based egress analysis measures the walking distance from every reachable spot on a floor to the nearest open exit, then reads routes, dead ends and common paths out of that one field. The prerequisite is a classified scan, where every point already carries a role, which is exactly what semantic segmentation produces.
If segmentation is the part you want to understand properly, my guide to 3D point cloud segmentation and clustering covers the methods. For the floor in this guide, I chose one anyone can download, so you never have to take my word for it: the classes came with the dataset, the S3DIS scans of Armeni and colleagues, and the tutorial’s code turned them into 296 m² of floor where a body actually fits.
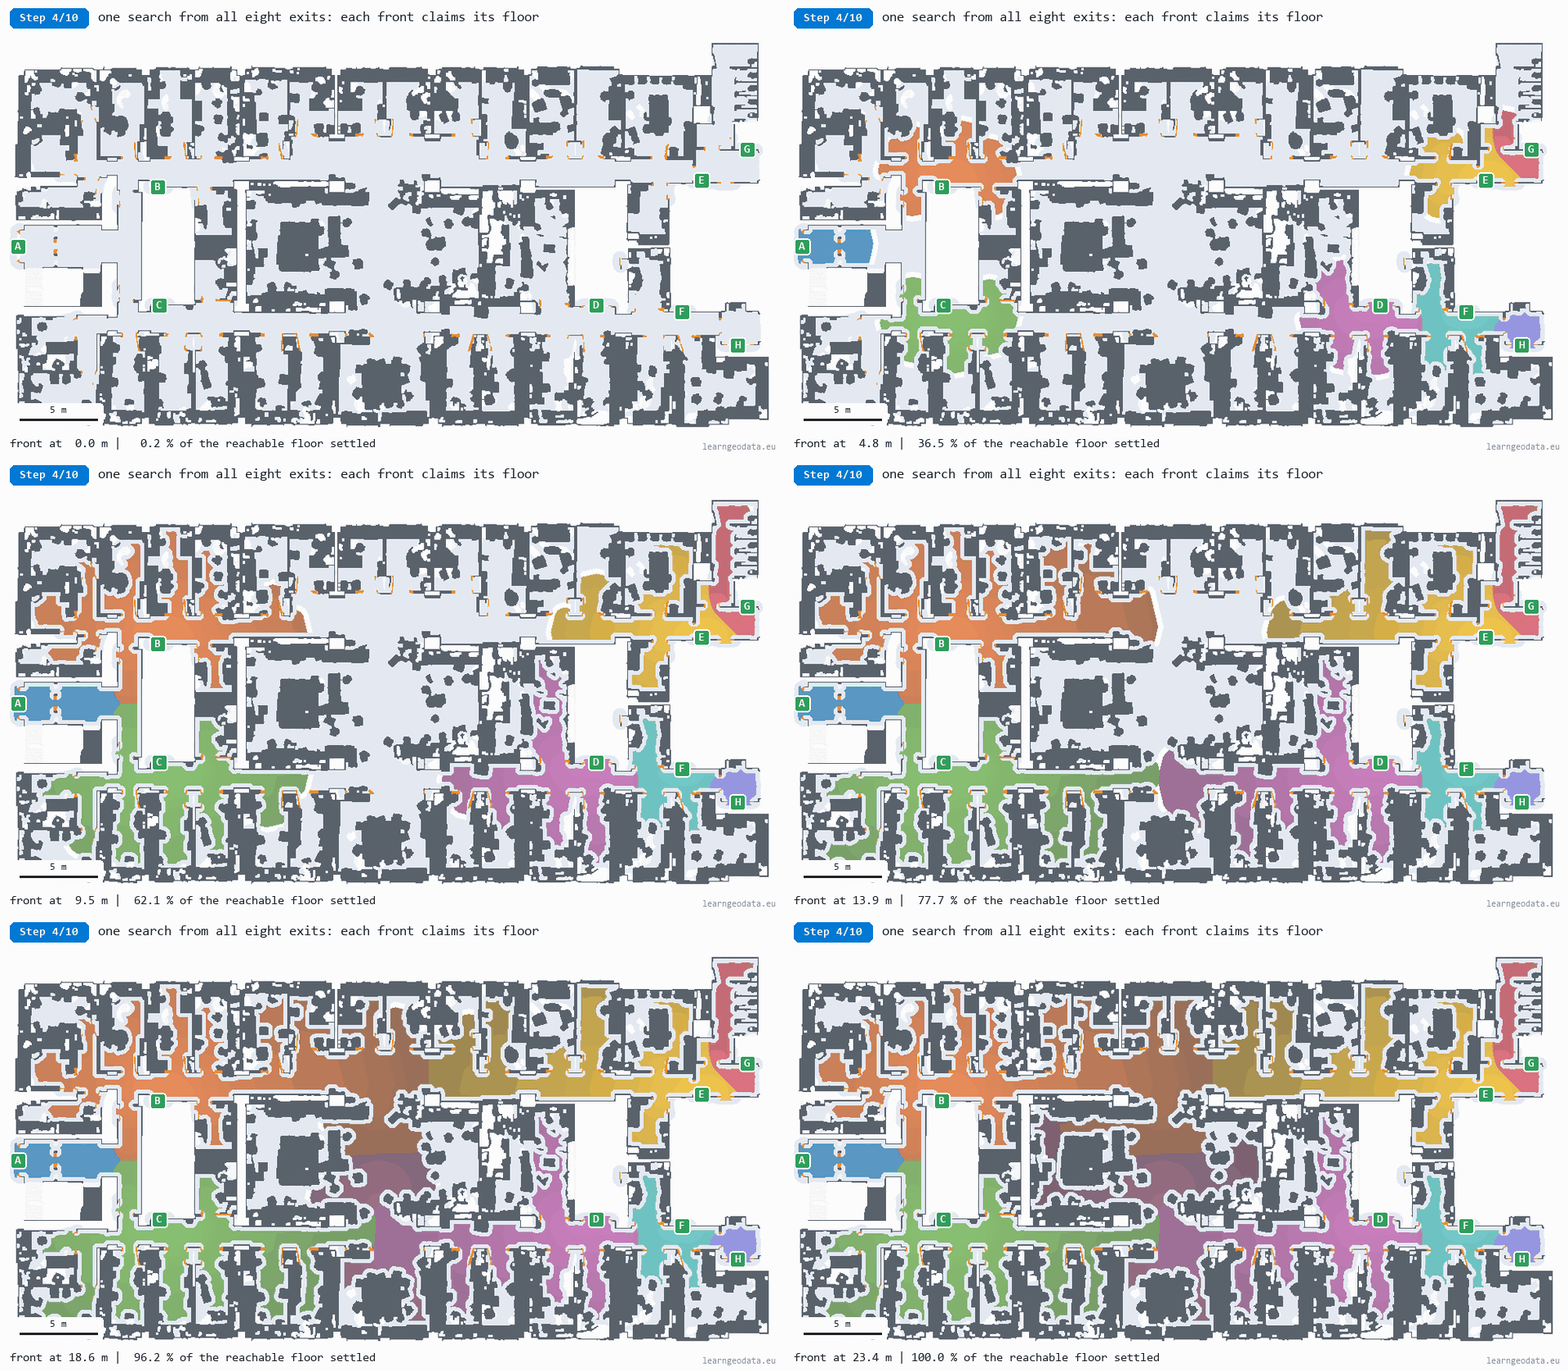
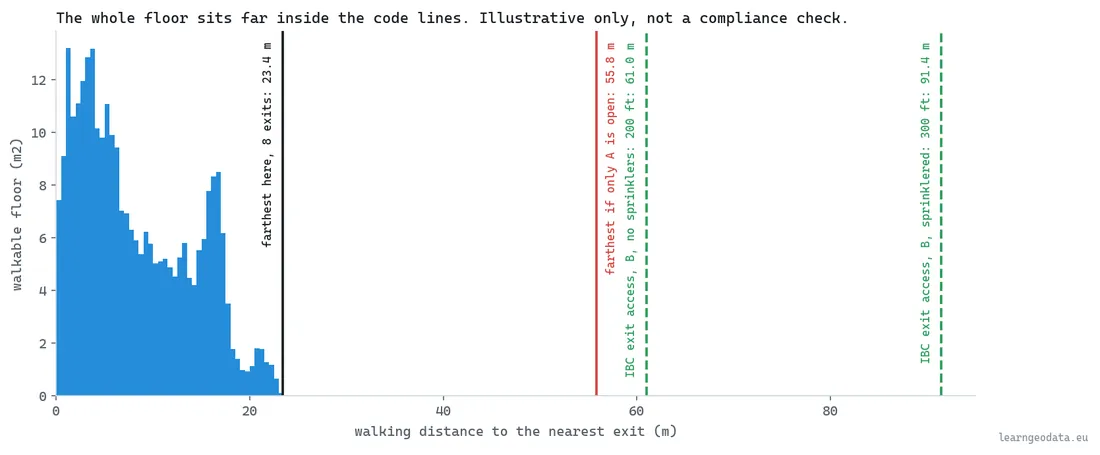
On that floor, with eight exits declared, the code solved one shortest-path search from all exits at once over 118,418 walkable cells. The farthest walkable spot sits 23.4 m from its nearest exit, roughly 19.5 seconds at a walking pace of 1.2 metres per second, in the open hall in the middle of the floor. The mean walk is 8.2 m.
Walking distance and straight-line distance diverge fast indoors. From one office on the west side, the tutorial’s route to its exit measured 15.97 m. The straight line from the same spot to the same exit’s marked position is about 13.2 m, so a crow-flies estimate would have shaved about a fifth off the real walk.
That one field answers several questions at once. Which exit serves which area: exit B is the nearest for 81.6 m² of walkable floor while exit H is the nearest for just 4.6 m². Which spots cannot reach any exit: 9.9 m² spread across 43 small pockets, like chairs pushed under desks, which deserve a look on site, because what the model walls off may be walled off in reality too.
Dead ends need more care than distances, and this is where naive tools mislead. On the scanned floor, 60 percent of the reachable floor has only one way out, which sounds alarming until you notice nearly all of that is single-door offices. Read with a fire engineer’s two definitions, the same geometry gives a longest common path of 8.4 m and seven dead-end corridors over 2 m.
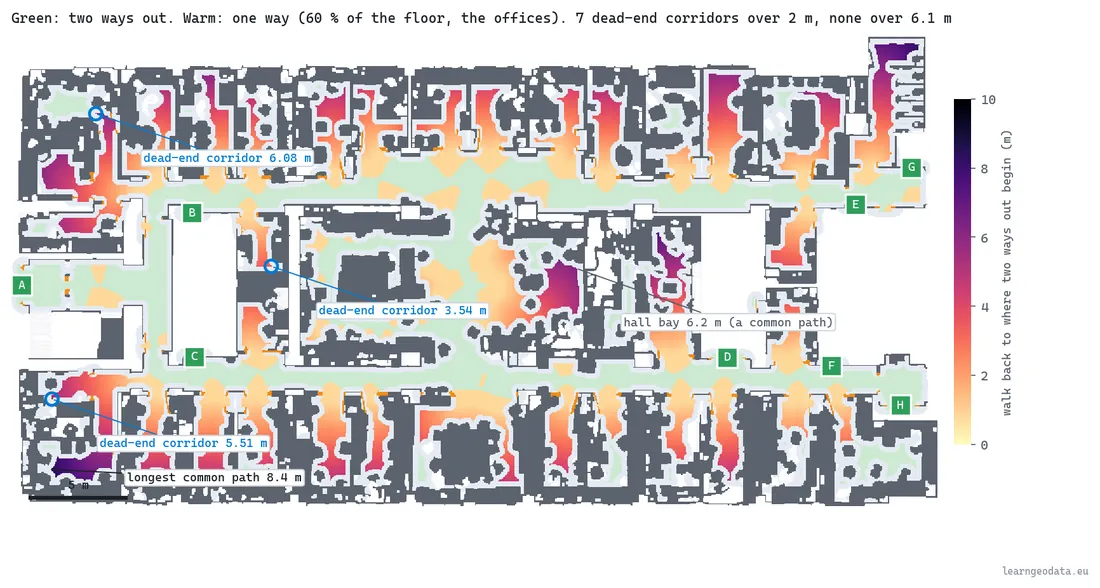
The longest of those dead ends measured 6.08 m, while the 20 ft limit converts to 6.096 m. Nudge every point of the scan by half a millimetre, well under scanner noise, and the same corridor reads 6.10 m. The honest output is “on the line, go and measure it”, and an analysis that says so is worth more than one that rounds the problem away.
🌱 Growing Note: When you commission a scan-based egress analysis, ask for every value within a few percent of its limit as a separate list, flagged for a tape check. On this floor that list has one entry, the 6.08 m corridor. A report that hides near-misses inside a green summary is telling you less than its data knows.
Get the Materials for This 3D Egress Analysis
If you want to check these numbers yourself rather than trust them, the evacuation distance map materials carry the code, the script that rebuilds this exact floor from the S3DIS copy you request from Stanford, plus my reference metrics to compare against. The build-it-yourself walkthrough, step by step, is the Medium tutorial on walking distance to the exit.
The Blocked Exit Test Every Building Manager Should Run
The blocked exit test is the one thing I would ask you to run from this guide, even if you skip everything else.
The blocked exit test removes one exit at a time, re-solves the whole floor, and records how far the worst walk grows, so you learn which door the building can least afford to lose. It is the question a posted plan cannot answer and the one an incident usually asks.
On the scanned floor, no single blocked exit added more than 2.9 m to the worst walk. Blocking exit B took it to 26.3 m, up from 23.4 m, and sent 10 rooms to a different door. Blocking exit A, the main entrance, changed the route of just 1 room. The door everyone knows is not the door this floor leans on.
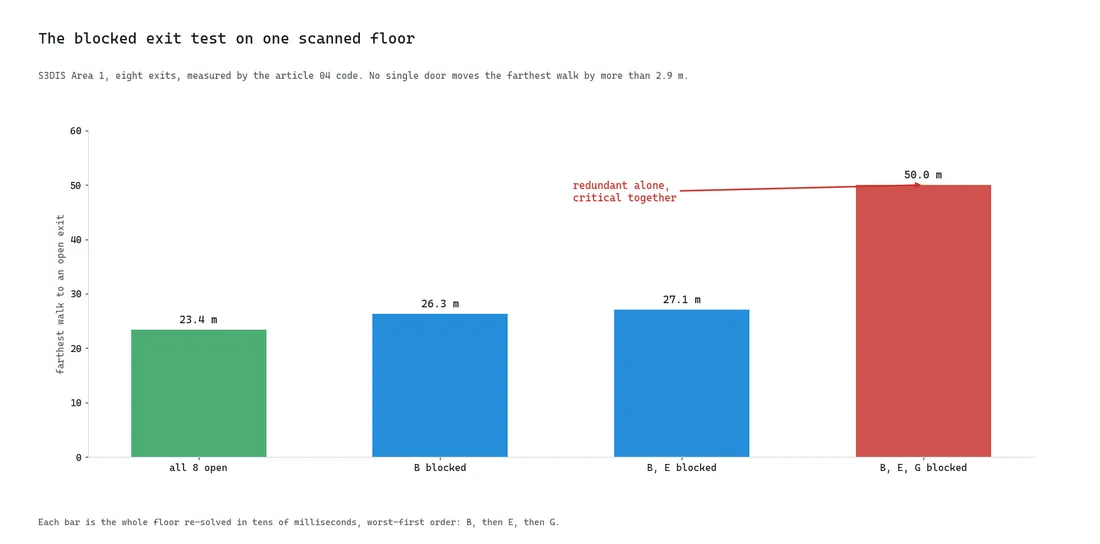
Pairs behave differently. With B already closed, closing E adds little (27.1 m), and closing G next sends the farthest walk to 50.0 m. That leaves 23.3 m of the north-west corridor with a single way out, and the common path of the offices beyond stretches to 28.6 m, beyond the 22.86 m limit. Two doors that look redundant alone are critical together.
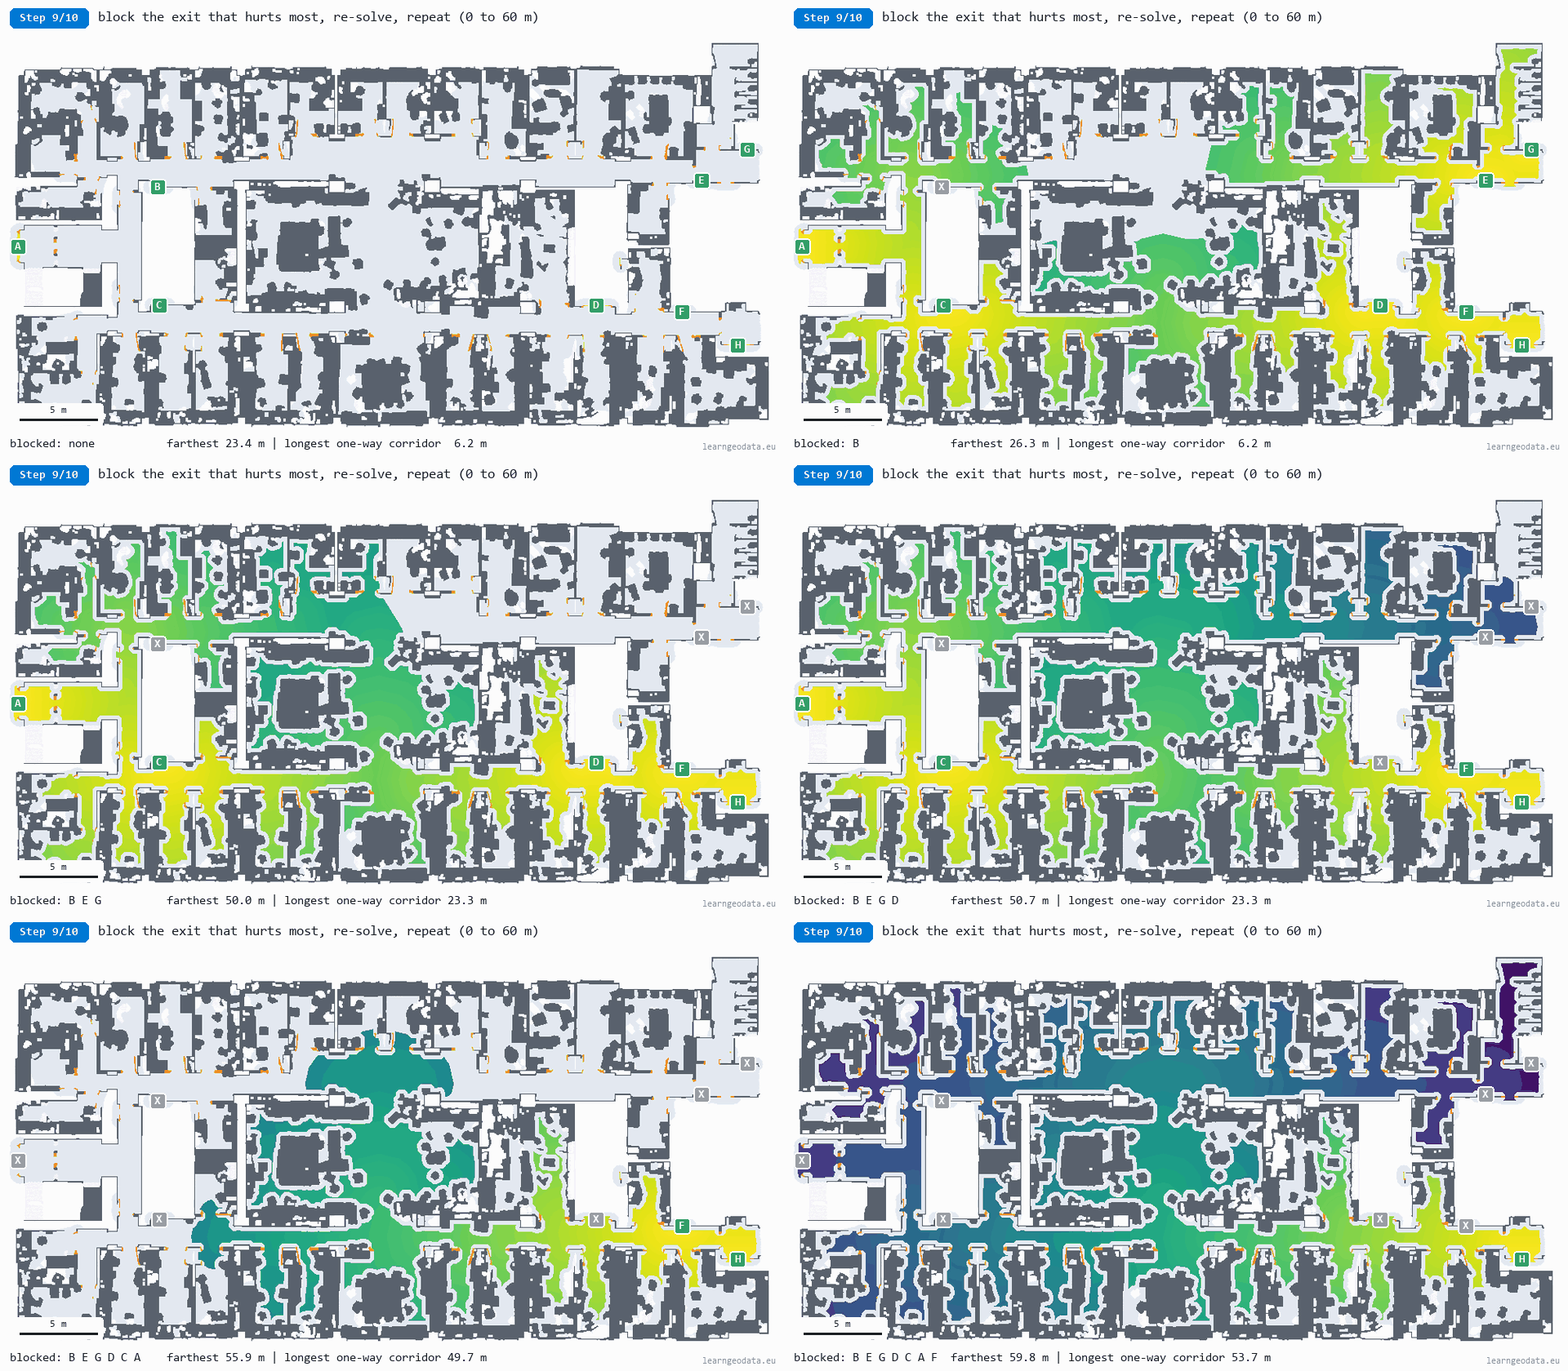
What makes this a management tool rather than a design calculation is speed. Each re-solve of that floor took tens of milliseconds on a laptop, between 33 and 66 ms across runs, so the full what-if table for eight exits costs less time than opening the PDF of the old fire strategy.
Neurones 3D exposes the same test as one click on an exit. In its explainer run the plan solves again in 398 ms after a click, and the routes that used the closed door move to the next one.
🦚 Florent’s Note: I would run this test every quarter and after every fit-out, and I would send the table, not the map, to whoever signs the safety budget. “If doors E and G are both locked, the farthest desk is 50.0 m from a way out” is a sentence a director reads twice. A coloured map is something they nod at.
What a Posted Evacuation Plan Must Show
A posted evacuation plan has a different reader from the analysis: somebody in a corridor filling with smoke, with four seconds to spare for your sign.
A posted evacuation plan must show the reader where they are, which way to go, and where the exits, safety equipment and assembly point are, on a drawing turned to match the direction they face. The sign has its own international standard, which I did not expect the first time I asked: ISO 23601 sets those design principles for escape plan signs, using the safety symbols of ISO 7010, so the plan reads the same in any building.
Beck’s diagram is the right model here, and it is the opposite of the analysis behind it. I think the 3D world lacks taste, and the posted plan is where that hurts first, because its reader has four seconds. The egress analysis needs every centimetre. The sign needs one route, a red “you are here” mark, and nothing a stressed person has to decode. Drop the geometry the reader does not need and keep the connections they do.
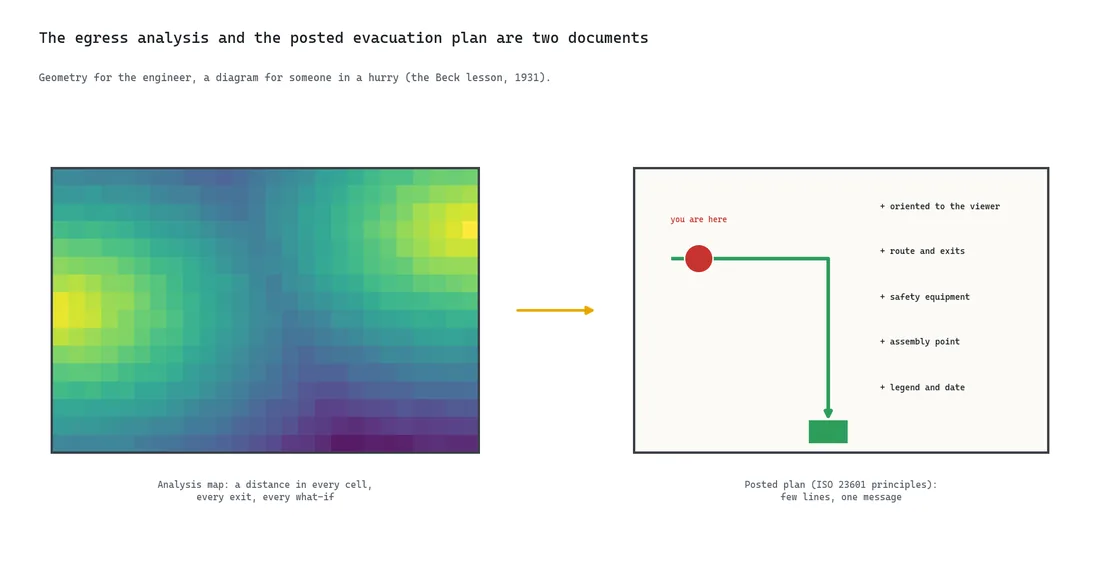
Here is a checklist I would give anyone approving a posted plan:
- The plan is rotated so “up” on the sign is the direction the reader faces.
- A clear “you are here” mark sits at the sign’s real position.
- The route to the nearest exit is drawn, with the alternative when one exists.
- Exits, fire extinguishers, alarm call points and the assembly point use standard ISO 7010 symbols.
- A legend, the plan date and the responsible person are printed on it.
- The route drawn matches the route the current analysis computes, not the one from the last refurbishment.
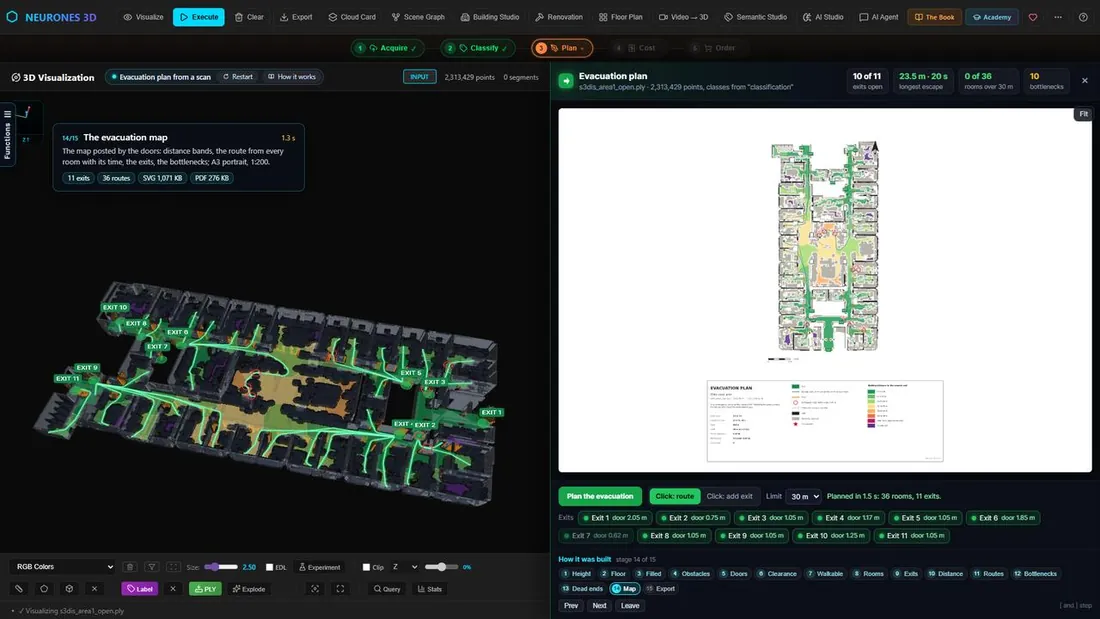
Point 6 is the one people skip. A beautifully designed sign that shows a route through a door now badged is worse than no sign, because it sends people confidently the wrong way.
Keeping Egress Current in a Fire Safety Digital Twin
A fire strategy filed in a drawer starts ageing the day the fit-out crew arrives.
Keeping egress current in a fire safety digital twin means recomputing the analysis whenever the building changes, not just when the fire strategy is due for renewal. The twin holds the scan, the classified floor and the exits; a change triggers a rescan of the affected floor, and the distances and what-ifs follow in seconds.
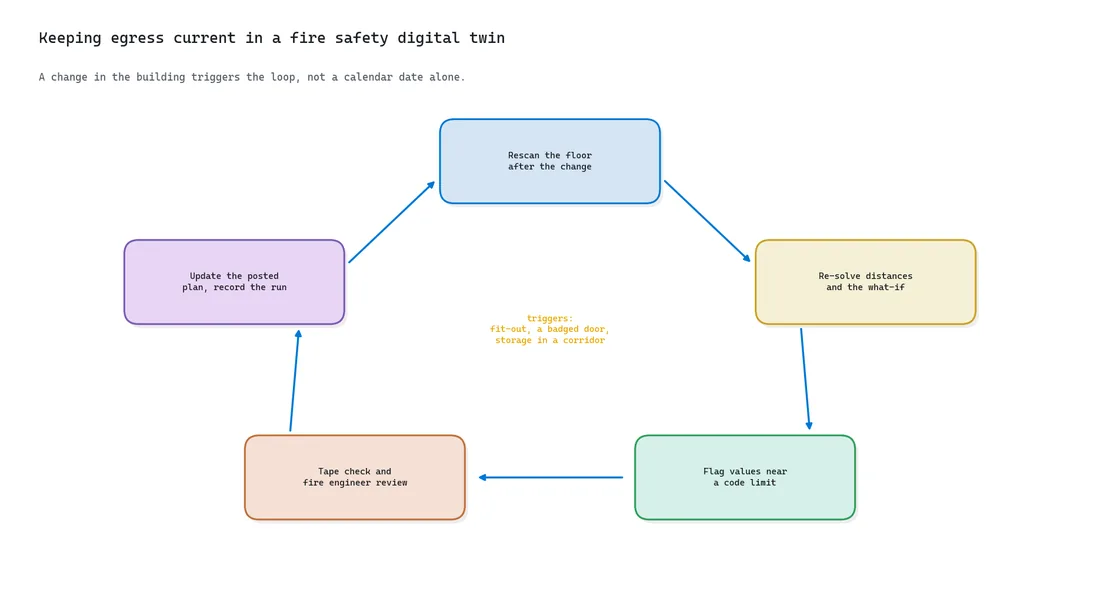
The triggers are ordinary facility events: a fit-out, a change of use, a new access-control rule, a corridor used as storage during works. The access-control system holds the list of doors locked at each hour. Feed that list into a field that re-solves in milliseconds, and the question of which occupied desk sits farthest from an unlocked exit at this moment gets a live answer.
The egress analysis also plugs into the rest of the twin. Condition forecasting, which I cover in the predictive digital twin guide, tells you when a door or a stair will need works; the blocked exit table tells you what closing it for those works does to everyone else on the floor.
🦥 Geeky Note: The trick that keeps re-solving cheap is separating what the building is from what you are asking of it. The floor, the walkable grid and the walking graph depend only on the scan; the open exits are just the list of sources. On the scanned floor, the whole tutorial pipeline, 36 what-if solves included, runs in 35 to 53 seconds on a laptop CPU.
Own Your Egress Analysis Instead of Ordering It Again
Egress analysis is often the first thing a client wants automated by tomorrow. I say yes, with a strong foundation under it: half a day looking at how the team works today, a semi-automated workflow they trust, and full automation only on the parts that have earned it. Owning the analysis is what makes each of those steps safe to take.
Owning your egress analysis means understanding what sits behind the “generate evacuation plan” button well enough to explain every number it prints. Pressing the button is easy.
Knowing that the distance map is one shortest-path search from all open exits, that a dead end and a common path are the same geometry read under two rules, and that the interesting output appears when you remove exits: that is what lets you argue with a fire officer and win, or lose for the right reasons.
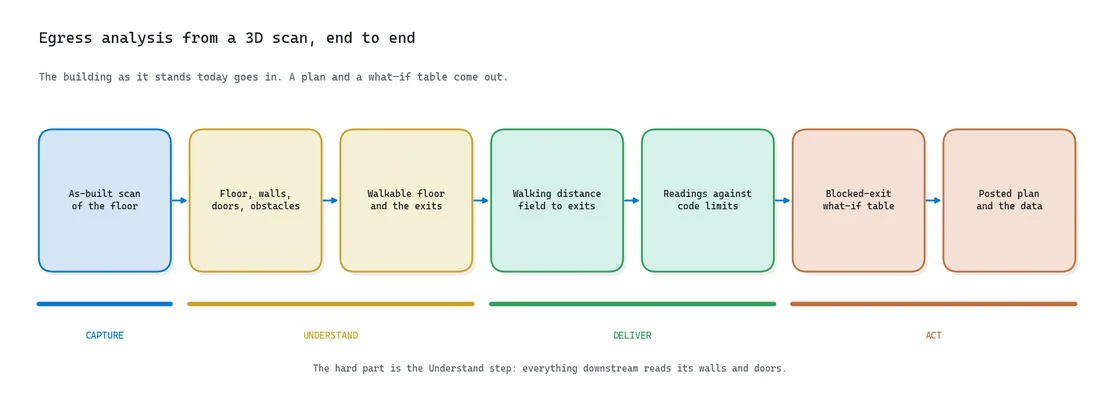
This is where I place the whole use case on Capture, Understand, Deliver, Act. Capture is the scan. Understand is floor, walls, doors and rooms, the hard part. Deliver is the distance map, the routes and the what-if table. Act is the decision someone takes: move a sign, clear a corridor, keep a door unlocked during office hours.
In the way I build these, three things stay yours: the question, the choice of method, and the checks that prove the answer, like a corridor whose length you knew before running the code. An engine does the running.
In Neurones 3D, Neurones Engine runs the stages, and Neurones Science is the SDK you use to rebuild them and add your own. To see the whole path from scan to decision on one page, the scan to knowledge page lays it out.
If you want to go further than one floor, the 3D AI Architect program covers this chain and many others, with the Python codebase underneath and the Neurones Science SDK to build an application of your own. For the data side, chapters of my book 3D Data Science with Python walk through loading, classifying and structuring indoor scans like this one.
Begin with one floor you know: get it scanned, declare its exits, and read three numbers: the farthest walk, the longest dead end, and the worst pair of blocked doors. The evacuation distance map materials give you the code and my reference results, so your first run has an answer to check against.
Then put the worst pair and its distance at the top of the next safety report; on this floor, that line reads E and G, 50.0 m.
Frequently Asked Questions About Egress Analysis
What is egress analysis in fire safety?
Egress analysis checks whether occupants can leave a building safely by measuring travel distance to exits, common path, dead-end corridors and exit capacity, then comparing them with the governing code, such as IBC 2021 chapter 10. Performance-based projects add a time comparison, showing that the required safe egress time plus a margin stays below the available safe egress time.
Can a 3D scan be used for egress analysis?
Yes, once the scan is classified into floor, walls, doors and obstacles. The scan then gives walking distances on the building as it stands today. On a scanned S3DIS office floor, one search from eight exits gave a farthest walk of 23.4 m. The scan cannot supply occupant numbers, door hardware or fire resistance, so a fire engineer still owns the verdict.
What is the difference between travel distance and common path of egress travel?
Travel distance is the full walk from the farthest point of a space to an exit. Common path is only the part walked before two separate ways out become available. In IBC 2021 a business floor without sprinklers allows 200 ft (60.96 m) of travel distance but 75 ft (22.86 m) of common path when it holds more than 30 people.
How long can a dead-end corridor be?
It depends on the code and the building. IBC 2021 caps it at 6.10 m (20 ft), or 15.24 m (50 ft) where a business occupancy is sprinklered. Approved Document B handles one-direction travel through its Table 2.1 limits instead, 18 m for an office. Always check the document your authority enforces.
What must an evacuation plan sign show?
A posted plan should show a “you are here” mark, the route to the nearest exit and its alternative, exits, safety equipment and the assembly point with standard ISO 7010 symbols, a legend and the plan date, oriented to the reader’s direction. ISO 23601 sets those design principles. The route drawn should match a current egress analysis, like the one on the Neurones 3D map.
SEO Keywords
fire safety analysis, fire safety analysis from 3D scan, evacuation plan from 3D scan, how to make an evacuation plan, egress analysis, travel distance to exit, means of egress requirements, dead end corridor limit, evacuation plan requirements, fire safety digital twin, egress analysis from 3D scan, blocked exit test, common path of egress travel, ISO 23601 evacuation plan

